
Revisiting Weight Classes

Weight classes are contentious. Sometimes they’re too broad, sometimes they’re too narrow, sometimes they constrict competition too much, and they certainly don’t represent “the real world” (whatever that is supposed to mean.)
I have a ruleset for competition that I’d like to eventually get rolling as an official promotion, but I figured since I was busting up old conventions anyway, I should look at weight classes too.
Humans come in all shapes and sizes, but there is actually a normal range for most people. The normal range, however, is not quite as easy to suss out mathematically as this implies.
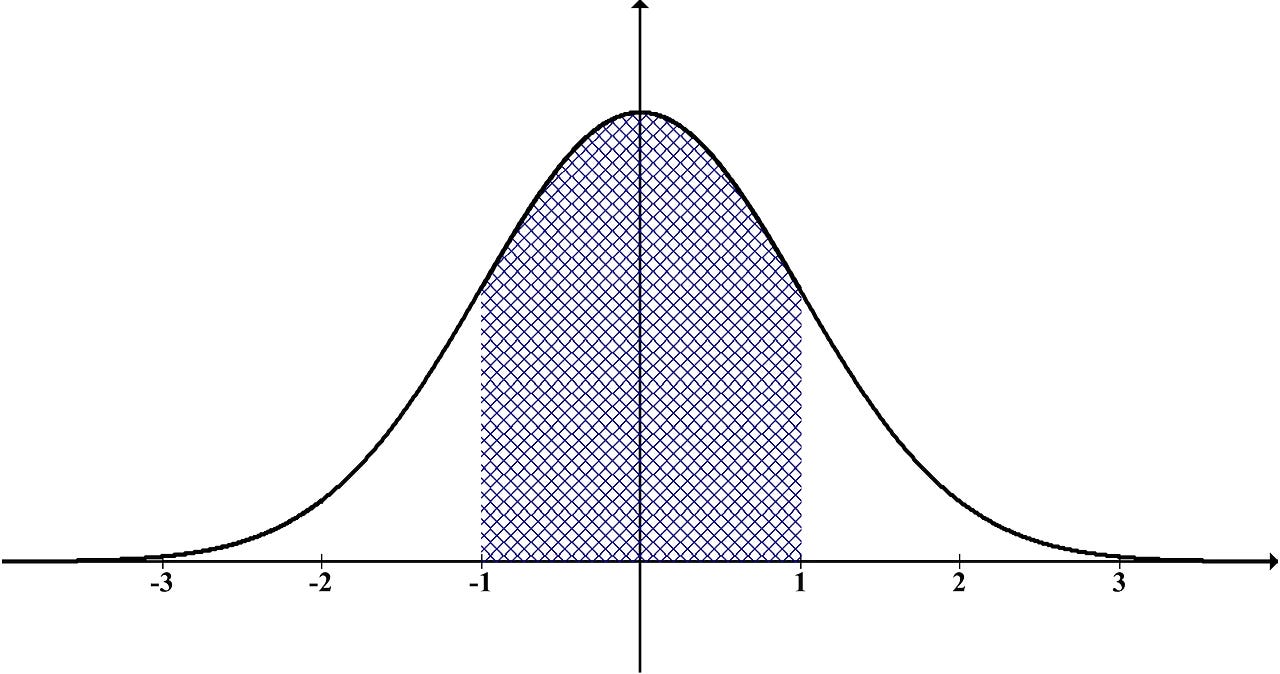
First we start with average height and the standard deviation. Human height falls pretty well within the normal distribution, which means that one standard deviation from the mean (+/-) is going to represent 68.27% of the population, 2 standard deviations will capture 95.45%, and 3 standard deviations will capture 99.73%. This means that we can account for almost everybody, except the true outliers. By way of comparison, for a scientific study to be considered high quality, it has to have a confidence interval of greater than 95%, meaning that the findings have less than a 5% chance of being due to random chance.
The US and global average height for men is about 5’10”, and for women it is about 5’5”. Depending on specific local/ethnic population, these numbers change, but since the US and Global averages are the same, this works fine as a starting point. We should also note that Official dwarfism is an adult height 4’10” or less (regardless of sex). Giantism is less defined, but generally doesn’t apply until 6’10” or so.
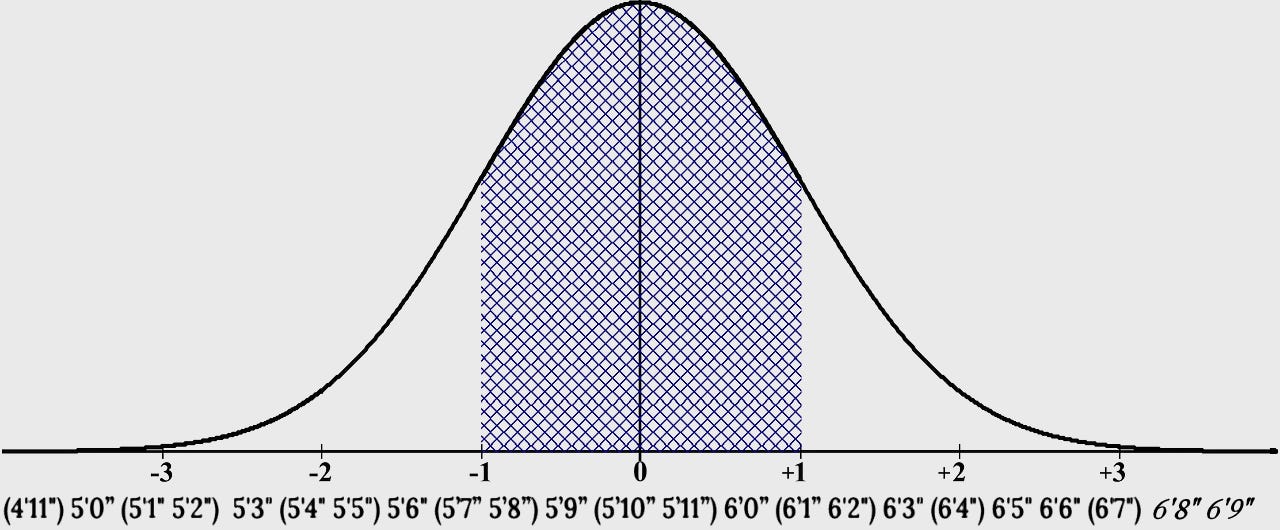
What is the standard deviation? We’re going to have to do some rounding, but for men it’s between 2.5” and 2.9”. For women it’s between 2.3” and 2.7”. Because sports don’t count partial inches, and it’s consistently over 2” (it actually averages out to 2.6 from these numbers, so a 2.5” standard deviation would be easy to calculate) we’re going to round it up to 3” intervals for a standard deviation. If we want to account for some of that imprecision, we can overlap the intervals at the 3” point. This would look something like:
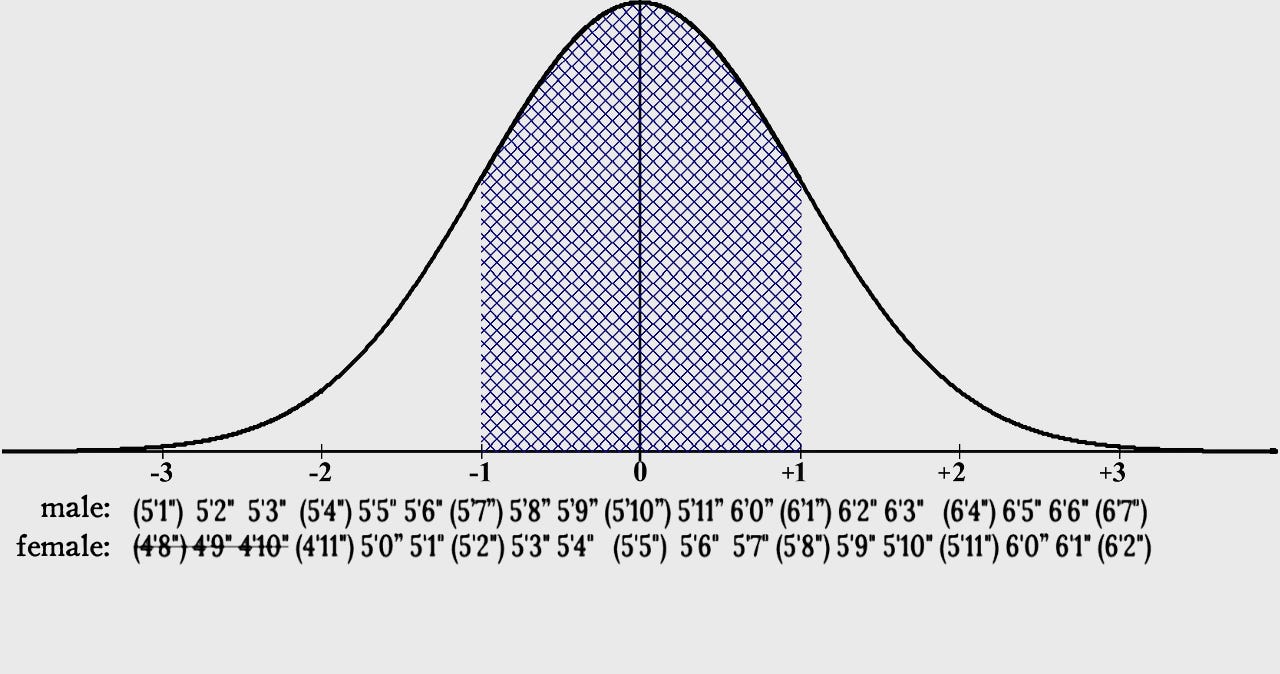
On the women’s line, we struck out the 3rd deviation on the low side because that’s where dwarfism starts. Because that is so rare a condition, it seems unreasonable to include in our calculations. In fact if you stack the heights so the numbers match, you have 2 inches past the -3rd deviation before dwarfism starts, and 2 inches past the +3rd deviation before giantism is proposed to start.
This gives us a pretty good place to start to begin evaluating for weight class. But how do we derive weight from height? Well, there are a couple of metrics, neither overly scientific, but both still reasonable that we can use to figure out a range of weight for each height. 1 is BMI, everybody’s favorite whipping boy, and the other a sampling of height to weight ratios from natural bodybuilders. Let me explain.
The Body Mass Index (BMI) despite not being overly precise, and definitely inappropriate for heavily muscled athletes, is still used by the medical industry as an early screening tool. Typically combined with a waist measurement, or even just a waist to height ratio, you can get a low resolution picture of size related health risk. It is particularly useful for morbid obesity and severe underweight.
There is the standard formula, and a revised formula that accounts better for people on the extreme ends of height.
Old formula: weight(kg)/height(m)^2 = 703*weight(lb)/height(in)^2
New Formula: 1.3*weight(kg)/height(m)^2.5 = 5734*weight(lb)/height(in)^2.5
Underweight is <18.5
Normal Range is 18.5-24.9
Overweight is 25-29.9
Obese is >30
Knowing that combat sports athletes are going to have more muscle than average, we can safely calculate for BMI of 19, 25, & 30 to get a reasonable data set, assuming they’re keeping their waistline in check. These simplify to about 1.5-2.1 pounds per inch of height on the 19BMI end of the range, 1.8-3 pounds per inch around 25BMI, and 2.1-3.7 pounds per inch around 30BMI.
Of course, we need to balance this against people who just pack on muscle. And because we don’t want tot skew to data too much, using natural bodybuilders is a good proxy. We can’t be sure they’re truly “natural”, but since combat sports are drug tested (yes, people still use PEDs, I know…) we can assume this is a better proxy than enhanced athletes. The reason for picking on bodybuilders is that their entire profession is to pack on as much muscle as possible with as little fat as possible, which will give us a good idea of how much a maximally muscled athlete might weight. Of course, a random sampling of champions, and nominal weights at the time of competition, with an estimated bodyfat percentage is far from scientific, but it’s what we have to work with. We also have evidence that elite female bodybuilders compete at a higher fat percentage, and lower muscle percentage, despite having more-or-less the same muscle building potential as men. So assuming around 5% bodyfat for men, and 10% for women, and that women tend to have about 85% of the muscle of their male counterparts, we come out with an average of about 2.7#/inch for men, and 2.3#/inch for women.
From these basic numbers, we can then calculate the off-season max-weight-gain these athletes could hypothetically take while staying in the healthy range of bodyfat (proposed as 25% for men, and 35% for women) and maximizing muscle growth. There is a roughly 1/4 muscle to 3/4 fat gain ratio on average ( individual genetics, habits, and drugs all can change this, so this is not concrete). So with BMI and Max-Muscle stats, we can make a chart on the 3 points of BMI and male and female maximum fat-free mass, and max overall (healthy) mass. It looks something like this:
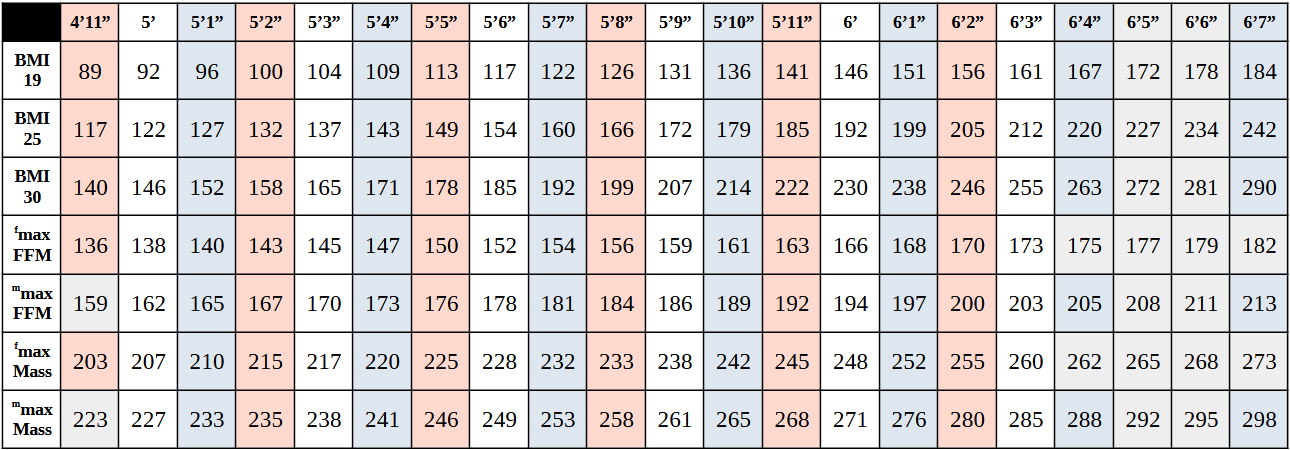
OK, so no we have a massive range of nominally healthy weights figured on some pretty squishy evidence, but it’s a lot better than what we had before. Judging by this, 99% of people should be somewhere between about 90lbs and 300lbs, and that actually seems entirely reasonable. But that also gives us a 210# spread to divide out our weight classes. This is where we need to come back to those standard deviations. The weight between deviations increases with height, which implies that the “width” of weight classes should increase as they go up as well.
If we group the weights by deviations, we get spreads of 10-15lbs on the low end, 15-20lbs in the middle, and 20-25lbs on the upper end (not being over precise, but using generous rounding). So putting that together, I would propose weight divisions as such:
<100 | 101-110 | 111-120 | 121-135 | 136-150 | 151-165 | 166-180 | 181-195 | 196-210 | 211-230 | 231-250 | 251-275 | 276-300 | >300
I don’t have fancy names for these weight classes, but there are 12 divisions plus extreme light and heavy that are open on one end. If we compare that to the current Unified Rules of MMA weight classes:
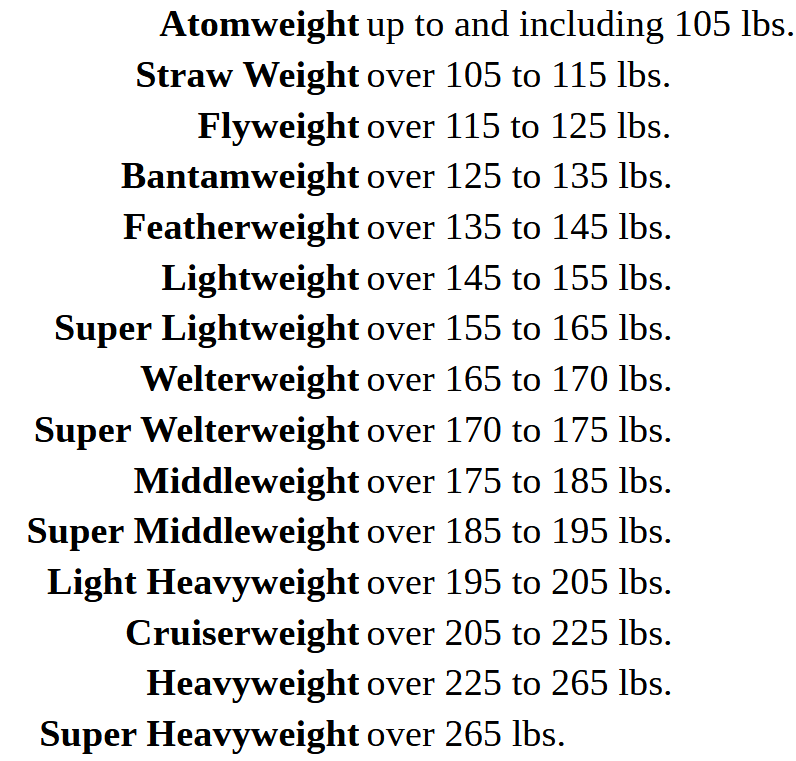
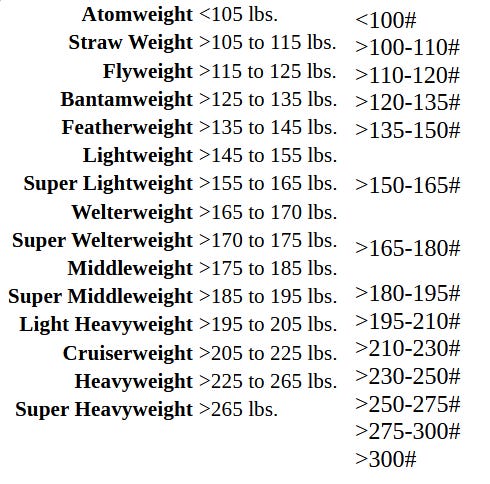
They’re not bad, but I feel like they keep a 10lb spread too deep in, and then welter and super-welter are only a 5lb spread each, and then you get 20lbs at cruiser, and 40lbs at heavy. The UFC doesn’t recognize cruiser, and has a 60lb spread at heavyweight. It’s ridiculous. With my proposed splits, there is one less division, and the heavies are split a bit more evenly. So let’s compare my divisions to the same labels:
So yeah, this is my proposed new weight class divisions, and if I ever get a chance to host my own event, I’ll probably go with something like this. I believe it is more fair to the heavies, and that it gives more wiggle room to the lights. It’s based on “being healthy” (though there’s plenty of room for people to be over or underweight still…) and I feel like it’s based on better demographic data. If we’re breaking with convention, let’s break everything!
~Good Journey